1. Our aim is to measure near-membrane Ca2+ flux within presynaptic terminals of central neurons by modifying new genetically encoded Ca2+ sensors to develop tools capable of measuring localised Ca2+ signals.
2. We used standard recombinant DNA technologies to generate the DNA coding for a fusion construct of a modified fluorescent “pericam” Ca2+ biosensor with a presynaptic P2X7 receptor (P2X7R). The Ca2+ sensitivity of the biosensor was modified by rational site-directed mutagenesis of the calmodulin portion of the pericam.
3. Biosensor-receptor fusions were transfected into expression systems for evaluation. Expression studies in Human Embryonic Kidney-293 (HEK-293) cells showed that biosensor-receptor fusion construct delivered protein was localised exclusively to the plasma membrane, confirming that fusion did not affect the ability of the receptor to undergo normal protein synthesis and trafficking.
4. The Ca2+-dependent fluorescence of the pericam portion of the fusion protein was also retained. Site-direct mutagenesis within the calmodulin moiety of the pericam significantly reduced the Ca2+ affinity of the complex. The dynamic range of the sensor following this modification is better matched to the higher Ca2+ levels expected within presynaptic Ca2+ micro-domains.
Ca2+ is a ubiquitous cellular messenger controlling a diverse array of physiological processes from fertilisation through to gene transcription, muscle contraction, cell proliferation and migration, cell differentiation and ultimately, cell death. Tight control of the spatial, temporal and concentration profile of Ca2+ influx is therefore required to define specific functional roles in cells. This is important in the neuronal setting, especially within the presynaptic terminal where the release of transmitter is critically dependent upon small changes in Ca2+ concentrations1. The invasion of an action potential into the presynaptic terminal opens voltage-dependent Ca2+ channels allowing the rapid influx of Ca2+ ions, giving rise to a small local volume (microdomain) of elevated Ca2+ 2-4. Ca2+ microdomains coincide with active zones that are areas of presynaptic membrane densely packed with Ca2+ channels and docked with neurotransmitter vesicles3. At these microdomains the Ca2+ concentration reaches approximately 100μM5 within 800 microseconds6, over distances of less than 1 μm from the point of entry7. Ca2+ microdomains are determinants of neurotransmitter release2 and play an important role in the modulation of synaptic strength8. Historically, it has been a challenging exercise to measure Ca2+ microdomains due to their small spatio-temporal profiles, with the most reliable data derived from modelling and simulation studies9. The difficulty in measuring Ca2+ microdomains means that a wide range of Ca2+-specific signalling processes may go undetected by the current ‘volume-averaged’ methods routinely used. There is clearly a need for a biosensor that is capable of sensing Ca2+ microdomains. Genetically encoded Ca2+ sensors based on green fluorescent protein (GFP) provide an exciting opportunity to develop tools to measure these localised signals.
GFP derived from Aequorea Victoria jelly fish is a 238 amino acid protein with an apparent molecular weight of 27-30kDa10. Several GFP mutants with distinct spectral qualities have been established as sensors of cellular dynamics, for example, in monitoring local pH or Ca2+ concentration inside cells11. A powerful example of this technology has been the recent development of pericams12 that consist of a single GFP variant sensitive to physiologically relevant substrates such as Ca2+ ions. To construct the pericams, circularly permuted enhanced yellow fluorescent proteins (cpEYFP) were used in which the amino and carboxyl portions had been interchanged and reconnected by a short spacer between the original termini. Calmodulin was fused to the C terminus of cpEYFP and its target peptide, M13, to the N terminus. The pericam was shown to be fluorescent with its spectral properties changing reversibly with the amount of Ca2+. Of the three major pericams developed, ratiometric-pericam (RP) appeared to be most promising, in that due to its capacity for dual excitation nature, it has potential for quantitative imaging.
Insertions of genetically encoded sensor into host receptors that already have localisation signals offers a new strategy for measuring localised Ca2+. Our goal is to measure Ca2+ microdomains within presynaptic terminals. The requirement therefore is a receptor that localises to the presynaptic membrane, but does not play a critical role in evoked release. The P2X7Rs are ligand-gated ion channels that are gated by ATP and other nucleotides13-15. Studies of expression patterns of P2X7R have confirmed localisation in presynaptic nerve terminals in both central and peripheral neurons16. Further, immunoreactivity studies in the hippocampus indicate that P2X7Rs colocalise with the vesicular glutamate transporter, (VGLUT1), placing them within excitatory terminals17. This makes P2X7R an ideal tool for targeting Ca2+ sensors to excitatory presynaptic nerve terminals in the hippocampus. Smart and colleagues have revealed that fusion of the purinergic P2X7R to GFP directed the complex to the plasma membrane in the simple HEK expression system18. Here we use this simple expression system to characterise a RP-P2X7R construct, determining its trafficking and Ca2+ sensing ability.
As Ca2+ concentrations within the presynaptic microdomains are thought to be in the 50-100µM range, the dissociation constant (Kd) of RP, reported to be 1.7µM, is therefore lower than required. As part of fine-tuning the Ca2+ affinities of a previous Ca2+ sensor, cameleons19, a number of mutations were performed in the calmodulin moiety of this construct to optimise the Kd for this reporting range. In particular a substitution mutation in the first Ca2+ binding loop of calmodulin, where the 31st amino acid was changed from glutamic acid (E) to glutamine (Q), shifted the titration curve of cameleon-1 to the right reflecting an increase in the Kd of its low affinity component from 11μM to 700μM19. Here we use a similar strategy to lower the affinity of the RP, making it more suitable for measuring the high Ca2+ concentrations expected in presynaptic microdomains.
To incorporate the E31Q mutation into RP a total of three PCR reactions were performed. First the cDNA of the 5’ portion of RP(E31Q) was amplified with a sense primer containing a HindIII restriction site and a reverse primer 5’ C GGT GCC AAG TTG CTT TGT GGT GAT GG (with the base change introducing the mutation of interest being underlined). For both RP and RP(E31Q) a glycine-rich spacer sequence, GGA GGT GCA GGT AGT GGA GGT corresponding to Gly-Gly-Ala-Gly-Ser-Gly-Gly, was included upstream of the start codon in the forward primer. In the second PCR reaction, the cDNA of the 3’ portion of RP(E31Q) was amplified with a forward primer: 5’CC ATC ACC ACA AAG CAA CTT GGC ACC G, and a reverse primer containing a XhoI restriction site. Finally the entire cDNA of RP(E31Q) was amplified with the HindIII and XhoI sites containing primers by using a mixture of the first and second PCR fragments as the template. The restricted product was cloned in-frame into the HindIII/XhoI sites of pcDNA3.1 (Invitrogen) vector. To generate the chimeric sensors, P2X7R-RP and P2X7R-RP(E31Q), a subcloning strategy was employed. The cDNA encoding P2X7R was amplified by using primers containing 5’Nhei and 3’HindIII restriction sites. The restricted PCR fragments were ligated to the 5’end of RP or RP(E31Q) gene in pcDNA3.1 to yield the tagged Ca2+ sensor constructs of P2X7R-RP and P2X7R-RP(E31Q).
To assess the spectral characteristics of the RP and RP(E31Q) proteins, HEK-293 cells were transfected with each DNA construct using LipofectamineTM2000 (Life Technologies). Transfected HEK-293 cells were lysed 3 days post transfection and liberated cytosolic proteins (RP and RP(E31Q)) were collected. To determine the Kds of RP and RP(E31Q), a Ca2+ Calibration Buffer Kit (Molecular Probes, C-3009) was used. The spectral properties of the proteins were measured using a Hitachi F-4010 Fluorescence Spectrophotometer. In separate experiments RP and RP(E31Q) were excited at 480nm, with an emission wavelength scan performed from 480 to 650nm. The solutions were maintained at pH 7.20 and 24°C. The Kd of both indicators (RP and RP(E31Q)) was calculated from a linearised (Hill) plot of fluorescence intensity as a function of Ca2+ concentration. Data were generated by scanning the emission spectrum of the indicator in the presence of different Ca2+ concentrations. All data for RP or RP(E31Q) were corrected for the fluorescence or a reference solution containing non-transfected HEK-293 cells (autofluorescence).
Fluorescence-based approaches were used to characterise the Ca2+ sensors. Two or three days after cDNA transfection with LipofectamineTM2000, HEK-293 adherent on poly-L-lysine-coated coverslips were analysed microscopically. Cells bathed in HEPES buffer (mM: NaCl 147, KCl 2, HEPES 10, Glucose 10, CaCl2 1 pH: 7.4) were imaged at 24°C on a laser scanning confocal (Biorad MRC-1024ES) employing an argon-ion laser, coupled to a Nikon Diaphot 300 microscope. Both the tagged and untagged RPs were illuminated at 488 nm, which excited the YFP portion of the constructs. YFP fluorescence emission of the RP was collected through a 510 long pass dichroic mirror and OG515 emission filter (>515nm). Fluorescence distribution patterns of tagged and untagged biosensors were achieved by collecting 512×512 pixel confocal images (slow scan rate – 1 s/image), a bright field or transmitted image, and a simultaneous image showing the colocalisation of the confocal signal with the transmitted image which revealed fluorescent cellular structures. Some images were taken as an average of 4 consecutive scans (Kalman algorithm) to smooth random noise fluctuations. For assessment of the Ca2+ sensing ability of the Ca2+ sensors the acquisition package ‘Timecourse’ was used. In any given field of cells several regions of interest (ROI) were defined. Examination of the Ca2+ sensing properties of the RP, RP(E31Q) or chimeric constructs was performed in transfected HEK-293 cells being exposed to 2.5μM ionomycin (Sigma).
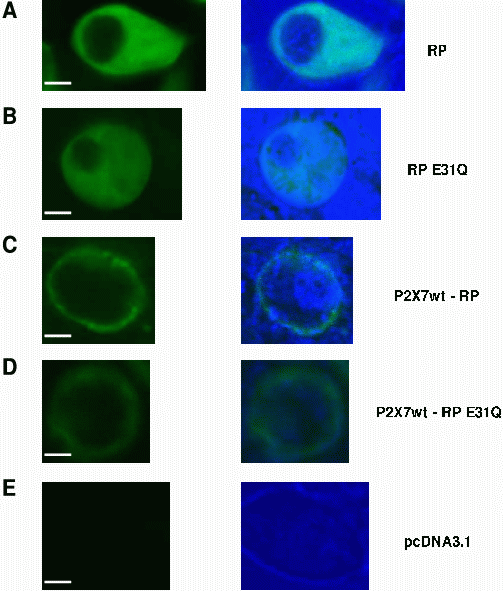
A fusion between a ratiometric pericam and a membrane targeted protein, the P2X7R was carried out using standard molecular biology techniques. This was revealed by imaging HEK-293 cells transfected with either the tagged (localised) or untagged (unlocalised) pericams and comparing fluorescence distribution patterns. As expected, untagged ratiometric pericams (RP) displayed a bright fluorescence intensity, which was confined to the cytosol but excluded from the nucleus (Figure 1A). Our targeting strategy of fusing the RP to P2X7R was tested next. P2X7R-GFP is known to localise to the plasma membrane in the HEK expression system18. P2X7R-RP exhibits an identical expression pattern (Figure 1C) to that of P2X7R-GFP, suggesting that the normal P2X7R trafficking is not disrupted by the addition of RP. The signal sequence on the P2X7R therefore directed the ratiometric pericams exclusively to the plasma membrane. Confirming the locality of the sensors provides us with the potential for exclusively reporting near-membrane Ca2+ signals.
Figure 1. Sub-cellular localisation of
tagged and untagged Ca2+ sensor
constructs expressed in HEK-293 cells.
Images were captured using a laser scanning
confocal microscope (488 excitation, >510 emission). Left panel
represents the fluorescence images, displayed at identical gain and
black level settings. Right panel is the co-registration of
the fluorescence image with transmission light image of the same
field. Transmission light images reveal the cell outline and presence
of organelles. Scale bar = 5μm.
A Ratiometric Pericam (RP)
B Ratiometric Pericam E31Q (RP(E31Q))
C P2X7R-RP
D P2X7R-RP(E31Q)
E pcDNA3.1 vector (control) which shows no fluorescence
The high affinity of RP makes it unsuitable to accurately measure the large Ca2+ flux expected at presynaptic microdomains. Site-directed mutagenesis within the calmodulin portion of the Ca2+ sensor, cameleon-1, shifts the fluorescence-Ca2+ relationship19. A single glutamic acid to glutamine mutation (RP(E31Q)) weakens the interaction between Ca2+ and its binding loop, decreasing the affinity of the sensor and increasing its dynamic range19. The mutation was introduced using a standard PCR protocol and it was confirmed by direct sequencing. RP and RP(E31Q) displayed virtually identical emission spectra, with an emission maximum at approximately 515nm, coinciding with the emission peak of the YFP portion of each pericam (Figure 2A). This observation confirms that the E31Q mutation did not alter the spectral characteristics of the protein. The E31Q mutation in RP altered the Kd from 2.1µM to 19.1µM effectively improving the dynamic range of 0.25μM-19μM to approximately 2μM-170μM (Figure 2B). RP(E31Q) expressed in HEK cells is uniformly distributed through the cytoplasm, but is excluded from the nucleus (Figure 1B). The P2X7R-RP(E31Q) construct was also generated and displayed an identical expression pattern to P2X7R-RP, limited to the plasma membrane (Figure 1D). The lower fluorescent signal seen with RP(E31Q) is consistent with its lower Ca2+ affinity (Figure 1C,D).
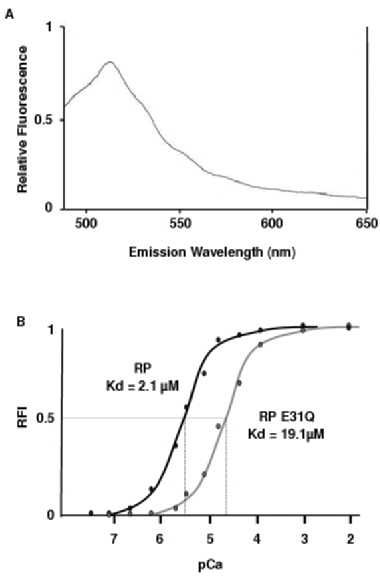
Figure 2. In-vitro properties of
ratiometric pericams.
A Fluorescence
emission spectrum of ratiometric pericam E31Q (RP(E31Q)).
HEK-293 cells transfected with RP(E31Q) were lysed and the
liberated cytosolic proteins containing RP(E31Q) were diluted
in phosphor-buffered saline (PBS). Emission wavelength scans
(490nm-650nm) were obtained using a spectrophotometer. The spectrum
was measured at 24°C and pH
7.20, and the results corrected for with a reference solution
identical in composition to the sample except for the absence of
RP(E31Q). The results were similar to YFP spectra, showing an
emission peak at approximately 515nm. A very similar emission
spectrum was obtained for RP (results not shown) with a maximum peak
at 510nm, indicating the maintenance of YFP spectral properties.
B Dose response
curves of ratiometric pericams, showing relative fluorescence
intensity (RFI) as a function of pCa (-log10[Ca2+]free).
The curves were generated by scanning the emission of the indicator
(RP or RP(E31Q)) at 515nm. The concentration of free Ca2+
ions in solution was varied by cross dilution
of Ca2+ (“high Ca2+
solution”) and EGTA (“low Ca2+
solution”) to produce a series of eleven
solutions with increasing [Ca2+]
while keeping the concentration of the indicator (RP or RP(E31Q))
constant. The pH was kept at 7.2 during experimentation. The E31Q
mutation shifted the dose response curve to the right, reflecting
a change in Kd from 2.1μM
for RP to 19.1μM for
RP(E31Q).
In turtle hair cells the Ca2+ concentration in Ca2+ microdomains was found to be at least 85μM7. Others have reported microdomain Ca2+ concentrations of 100-200μM, necessary to produce rapid neurotransmitter secretion5. With a dynamic range of 0.25μM-19μM the original RP indicator would be expected to saturated at these high concentrations. However, the RP(E31Q), with a dynamic range of 2μM-171μM, is ideally suited to the expected levels of Ca2+ concentrations within presynaptic microdomains.
HEK-293 cells transfected with each pericam were exposed to the ionophore ionomycin (2.5µM). Both the P2X7R-RP and P2X7-RP(E31Q) sensors demonstrated an increase in fluorescence intensity in response to application of ionomycin (Figure 3). As expected, P2X7R-RP showed a significantly larger change in fluorescence intensity than the lower affinity sensor, P2X7-RP(E31Q). These experiments demonstrate that the Ca2+ sensing abilities of the RP and RP(E31Q) are not altered when fused to the P2X7R and expressed in a mammalian cell line. Further studies are required to demonstrate this in primary neuronal cultures and other neuronal preparations.
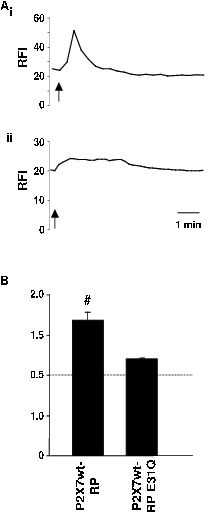
Figure 3. Responses of chimeric Ca2+
sensor constructs when expressed in
HEK-293 cells to 2.5 μM
ionomycin.
A Typical responses of HEK-293 cells
expressing: (i) P2X7R-RP, (ii) P2Xt-RP(E31Q) upon
application of ionomycin (2.5μM)
as indicated by the upward arrows below each trace. RFI indicates
relative fluorescence intensity. Application of ionomycin caused a
transient increase in relative fluorescence intensity in each case,
but the response of P2X7R-RP(E31Q) was smaller as compared to
the response of P2X7R-RP. All experiments were performed in HEPES
solution containing 1mM CaCl2. For each trace the
horizontal bar indicates 1 minute.
B
Collated responses of HEK-293 cells
expressing each of the chimeric Ca2+
sensor constructs, P2X7R-RP (n=13
cells), P2X7R-RP(E31Q) (n=9 cells) to 2.5µM ionomycin.
F/F0 indicates peak fluorescence intensity over basal fluorescence
intensity. Responses are expressed as mean F/F0 ± s.e.m. #
P<0.05 (one-way Anova) significantly different to P2X7R-RP(E31Q).
Using simulation studies, Fogelson and colleagues9 predicted with a three dimensional model that Ca2+ enters the presynaptic terminal through discrete membrane channels and acts to release transmitter within 50nm of the entry point. In turtle hair cells the initial diameter of Ca2+ microdomains was found to be less than 1 μm, as estimated by confocal microscopy7. Hence, Ca2+ microdomains can have very restricted spatial profiles and restricting even a sensor to the membrane may not guarantee localisation within Ca2+ microdomains (e.g. in neurons). However, one could still expect much better signal-to-noise ratios with a membrane-delimited sensor as opposed to a generalised cytosolic sensor. Therefore, a localised biosensor responding selectively to Ca2+ signals near the presynaptic membrane will provide a valuable tool to more accurately measure these signals. Further experiments will determine how close we can get.
The Ca2+ microdomains within presynaptic nerve terminals are highly localised and the concentrations of Ca2+ within these regions are thought to be significantly larger than the global cytosolic concentration. By measuring ‘volume-averaged’ global signals in response to stimuli, important information about these compartmentalised functions remains undetected. In this study biosensors have been designed with characteristics suited to investigating Ca2+ microdomains within presynaptic terminals. We generated a fusion protein of a ratiometric pericam (with modified Ca2+-sensing ability) and a P2X7 receptor, a protein known to localise to the presynaptic membrane of excitatory neurons. Fusion proteins successfully trafficked to the plasma membrane distribution of HEK cells and were capable of responding to changes in intracellular Ca2+. Our next goal is to characterise these sensors in a neuronal setting, confirming localisation and Ca2+ sensing ability and refining these properties where necessary. Ultimately, we hope to study Ca2+ dynamics in brain slices derived from various mouse and rat models of relevant human diseases. The generation of genetically encoded fluorescent biosensors described is expected to continue to expand and provide exciting new insights into normal physiological and pathological processes in neurons.
Supported by funding from NHMRC and ARC (Australia). We are grateful for the careful proofreading of Samantha Ferguson.
1. Reid CA, Bekkers JM, Clements JD. N- and P/Q-type Ca2+ channels mediate transmitter release with a similar cooperativity at rat hippocampal autapses. J. Neurosci. Apr 15 1998;18(8):2849-2855.
2. Augustine GJ. How does calcium trigger neurotransmitter release? Curr Opin Neurobiol. Jun 2001;11(3):320-326.
3. Llinas R, Sugimori M, Silver RB. Microdomains of high calcium concentration in a presynaptic terminal. Science. May 1 1992;256(5057):677-679.
4. Jarvis SE, Zamponi GW. Interactions between presynaptic Ca2+ channels, cytoplasmic messengers and proteins of the synaptic vesicle release complex. Trends Pharmacol Sci. Oct 2001;22(10):519-525.
5. Heidelberger R, Heinemann C, Neher E, Matthews G. Calcium dependence of the rate of exocytosis in a synaptic terminal. Nature. Oct 6 1994;371(6497):513-515.
6. Sugimori M, Lang EJ, Silver RB, Llinas R. High-resolution measurement of the time course of calcium-concentration microdomains at squid presynaptic terminals. Biol. Bull. Dec 1994;187(3):300-303.
7. Tucker T, Fettiplace R. Confocal imaging of calcium microdomains and calcium extrusion in turtle hair cells. Neuron. Dec 1995;15(6):1323-1335.
8. Zucker RS. Calcium- and activity-dependent synaptic plasticity. Curr Opin Neurobiol. Jun 1999;9(3):305-313.
9. Fogelson AL, Zucker RS. Presynaptic calcium diffusion from various arrays of single channels. Implications for transmitter release and synaptic facilitation. Biophys. J. Dec 1985;48(6):1003-1017.
10. Tsien RY. The green fluorescent protein. Annu. Rev. Biochem. 1998;67:509-544.
11. Gerdes HH, Kaether C. Green fluorescent protein: applications in cell biology. FEBS Lett. Jun 24 1996;389(1):44-47.
12. Nagai T, Sawano A, Park ES, Miyawaki A. Circularly permuted green fluorescent proteins engineered to sense Ca2+. Proc. Natl. Acad. Sci. USA. Mar 13 2001;98(6):3197-3202.
13. North RA, Surprenant A. Pharmacology of cloned P2X receptors. Annu. Rev. Pharmacol. Toxicol. 2000;40:563-580.
14. Paukert M, Hidayat S, Grunder S. The P2X(7) receptor from Xenopus laevis: formation of a large pore in Xenopus oocytes. FEBS Lett. Feb 27 2002;513(2-3):253-258.
15. Rassendren F, Buell GN, Virginio C, Collo G, North RA, Surprenant A. The permeabilizing ATP receptor, P2X7. Cloning and expression of a human cDNA. J. Biol. Chem. Feb 28 1997;272(9):5482-5486.
16. Deuchars SA, Atkinson L, Brooke RE, et al. Neuronal P2X7 receptors are targeted to presynaptic terminals in the central and peripheral nervous systems. J Neurosci. Sep 15 2001;21(18):7143-7152.
17. Atkinson L, Batten TF, Moores TS, Varoqui H, Erickson JD, Deuchars J. Differential co-localisation of the P2X7 receptor subunit with vesicular glutamate transporters VGLUT1 and VGLUT2 in rat CNS. Neuroscience. 2004;123(3):761-768.
18. Smart ML. Molecular Basis of P2X7R Pore Formation (Thesis). The laboratory of Biophysics and Molecular Biology. Department of Physiology, The University of Melbourne. 2002.
19. Miyawaki A, Llopis J, Heim R, et al. Fluorescent indicators for Ca2+ based on green fluorescent proteins and calmodulin. Nature. Aug 28 1997;388(6645):882-887.