1. Evidence is accumulating for a role for Ca2+ signalling in the differentiation and development of embryonic skeletal muscle.
2. Imaging of intact, normally developing transgenic zebrafish that express the protein component of the Ca2+-sensitive complex, aequorin, specifically in skeletal muscle, show that two distinct periods of spontaneous synchronized Ca2+ transients occur in the trunk: at ∼17.5 hours post-fertilization (hpf)-19.5 hpf (termed signalling period, SP1); and after ∼23 hpf (termed SP2). These periods of intense Ca2+ signalling activity are separated by a quiet period.
3. Higher resolution confocal imaging of embryos loaded with the fluorescent Ca2+ reporter, calcium green-1 dextran, show that the Ca2+ signals are generated almost exclusively in the slow muscle cells, the first muscle cells to differentiate, with distinct nuclear and cytoplasmic components.
4. Here, we show that coincidental with the SP1 Ca2+ signals, dystrophin becomes localized to the vertical myoseptae of the myotome. Introduction of a dmd morpholino (dmd-MO) resulted in no dystrophin being expressed in the vertical myoseptae, as well as a disruption of myotome morphology and sarcomere organisation. In addition, the Ca2+ signalling signatures of dmd-MO-injected embryos or homozygous sapje mutant embryos were also abnormal such that the frequency, amplitude and timing of the Ca2+ signals were altered, when compared with controls.
5. Our new data suggest that in addition to a structural role, dystrophin may function in the regulation of [Ca2+]i during the early stages of slow muscle cell differentiation when the Ca2+ signals generated in these cells coincide with the first spontaneous contractions of the trunk.
Evidence is steadily accumulating to support the proposition that Ca2+ signalling plays a necessary and essential role in regulating embryonic muscle differentiation and development.1-13 What is currently lacking, however, is extensive direct visualization of the spatial dynamics of the Ca2+ signals generated by differentiating muscle cells, especially in intact systems. Furthermore, the recent development and application of reliable imaging techniques has begun to add an extra dimension of complexity with regards to understanding the roles played by Ca2+ signalling during muscle development. For example, it is clear from imaging both isolated myotubes and intact systems, that membrane-bound sub-cellular compartments, such as the nucleus,14,15 may have endogenous and distinct Ca2+ signalling activities, as do specific cytoplasmic domains, such as the subsarcolemmal space.8
In contrast to the growing body of data derived from tissue culture cells, there is relatively little known about Ca2+ signalling during in vivo skeletal muscle development in intact animal models, such as zebrafish. In zebrafish, the different types of skeletal muscle are derived from the myotome region of the trunk and their development is regulated by the interaction of a number of complex signalling networks.16-18 Slow muscle cells (or red muscle cells) exhibit low force, long duration contractions.19 They form from a population of muscle precursor cells, termed adaxial cells, which initially lie adjacent to the notochord prior to the start of segmentation when the somites begin to form.20,21 Shortly after the segmentation process starts, the majority of the adaxial cells, which are at first cuboidal in shape, elongate to extend across the anterior-posterior axis of the somite and then the majority migrate from the medial to lateral region of the somite until they finally come to lie at the periphery of the myotome as a superficial monolayer of ∼20 cells.20,22 As the adaxial cells migrate, they differentiate into slow muscle cells.20 The non-adaxial cells in the myotome do not migrate and these differentiate into the fast muscle cells (or white muscle cells),20 (Figure 1) which in contrast to the slow muscle cells exhibit high force, short duration contractions.19
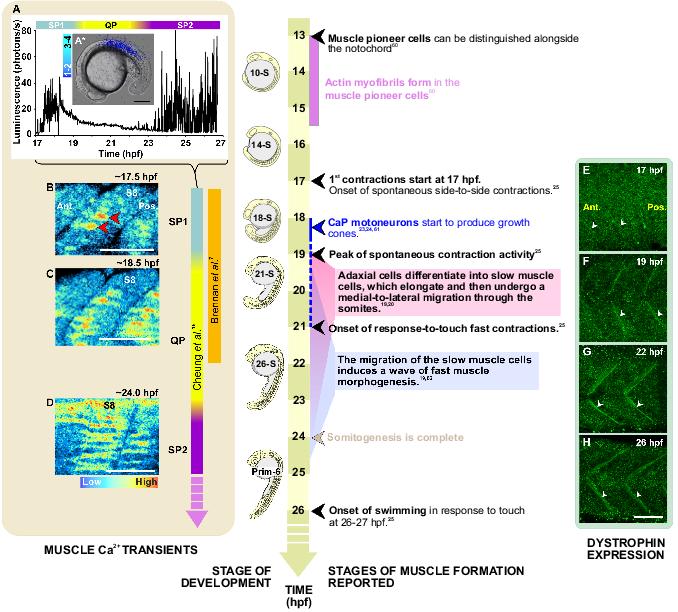
Figure 1. A timeline of skeletal muscle development in zebrafish. The series starts at ∼13 hpf when the muscle pioneer cells can first be distinguished, localized adjacent to the notochord, to 26 hpf and the onset of swimming. Superimposed on the developmental timeline are: A: A representative profile of aequorin-generated light from 17 hpf to 27 hpf (i.e. the 16-somite to Prim-8 stage). Data were plotted every 10 s, each data point representing 60 s of accumulated luminescence in a region of interest covering the entire embryo. A*: A representative example of an SP1 Ca2+ transient generated in the anterior somites at ∼17.5 hpf, which has been superimposed on a bright-field image of the embryo. Colour scale represents luminescence flux in photons/s. B-D: The patterns of Ca2+ signals observed at ∼17.5 hpf, ∼18.5 hpf and ∼24 hpf when embryos were loaded with calcium green-1 dextran and imaged via confocal microscopy. Colour scale indicates level of fluorescence. Ca2+ signalling periods 1 and 2 (SP1 and SP2) and the Ca2+ signalling quiet period (QP) observed in slow muscle cells during development15 are labeled. E-H: The localization of dystrophin in the vertical myoseptae. Embryos were labeled at 17 hpf, 19 hpf, 22 hpf and 26 hpf via immunohistochemistry with the MANDRA-1 anti-dystrophin antibody. White arrowheads (E-H) show the localization of dystrophin in the vertical myoseptae. Scale bars, (A*) 200 μm and (B-H) 50 μm. Ant. and Pos. are anterior and posterior. respectively.
When investigating myogenic Ca2+ signalling in intact developing zebrafish, Brennan et al.7 used the fluorescent Ca2+ reporter, Oregon green 488 BAPTA-dextran (Kd = 265 nM) and reported spontaneous Ca2+ signals in differentiating slow muscle cells between ∼17.25 and ∼21.5 hours post-fertilization (hpf). This time period is coincidental with the time when the first neuromuscular contacts are known to form (i.e. between ∼18 to 21 hpf)23 and the Ca2+ signals were shown to coincide with the first spontaneous contractions of the trunk muscle at ∼17 hpf.24,25 Brennan et al.7 also demonstrated that the Ca2+ signals could be abolished, along with the contractions, by treatment with the nicotinic acetylcholine receptor inhibitor, α-bungarotoxin. Furthermore, treatment with α-bungarotoxin or the ryanodine receptor (RyR) inhibitor, ryanodine also disrupted the organization of slow muscle cell myofibrils. They thus proposed a critical role for spontaneous nerve-mediated myogenic Ca2+ signalling in the differentiation of physiologically functional slow muscle cells during zebrafish development. While Brennan et al.7 clearly observed Ca2+ signals being generated by the slow muscle cells, they did not report any signals being generated from fast muscle cells or associated primary motor neurons during this period. On the other hand, Horikawa et al.26 used a new family of Ca2+ reporters based on Yellow Cameleons (YCs); i.e. YC3.60 (Kd = 215 nM) and the ultra-sensitive YC-Nano50 (Kd = 50 nM), and reported Ca2+ signals from all three cell types, i.e. slow muscle cells, fast muscle cells and primary motor neurons, from ∼20 hpf.
Most recently, we reported the successful generation of a transgenic zebrafish line that expresses the apoprotein portion of the Ca2+-sensitive bioluminescent complex aequorin, targeted specifically to muscle using a muscle-specific α-actin promoter.15 Using these fish, we identified two distinct and highly reproducible periods of spontaneous Ca2+ signalling, again generated exclusively by slow muscle cells in the trunk musculature. These occur between ∼17.5 and 19.5 hpf (Signalling Period 1: SP1) and from ∼23 hpf onward (Signalling Period 2: SP2), with a Ca2+ signalling quiet period of around 3.5 h duration between the two.15 We also confirmed that the SP1 Ca2+ signals were being generated exclusively by the slow muscle cell population by aequorin-based imaging of cyclopamine- or forskolin-treated embryos and smu-/- mutant embryos, in which slow muscle cells do not form.27,28 Furthermore, we treated embryos with α-bungarotoxin, ryanodine or antagonists of the dihydropyridine receptor (i.e. nifedipine) and the inositol 1,4,5-trisphosphate receptor (IP3R, i.e. 2-APB), and our results indicated that the SP1 signals are mediated through endogenous neuronal activation of acetylcholine receptors, followed by stimulation of dihydropyridine receptors, resulting in the spatially-restricted release of Ca2+ from intracellular stores via both IP3Rs and RyRs.15
In summary, there is a growing body of data derived mainly from tissue culture cells but that is supported by a relatively small number of reports from whole embryos, which suggest that Ca2+ signalling in a variety of forms plays an essential role in skeletal muscle cell differentiation.7,15,26 The new data reported in this paper, serves to compare the Ca2+ signalling patterns generated by embryos lacking (or induced to lack) the key muscle-associated protein, dystrophin, with those that we have previously reported in intact wild-type embryos.15
Much of our recent knowledge of dystrophin function has been derived from studying mdx mice that are null mutants of the Duchenne muscular dystrophy (dmd) gene, and which display some of the features that characterize human Duchenne muscular dystrophy (DMD).29 In zebrafish, the recessive lethal mutation sapje causes progressive degeneration of skeletal muscle, and the mutation has been shown to disrupt the zebrafish orthologue of the human dmd gene. In wild-type zebrafish at ∼26 hpf, dystrophin has been reported to be associated with the sarcolemma, with particularly strong localization to the vertical myoseptae.30,31 Sapje mutants, however, are characterized by an absence of dystrophin; an associated failure of muscle attachment at the myoseptae; and a progressive loss of muscle integrity.31 Zebrafish treated with morpholinos (MO) targeted to different regions of the dmd gene also exhibit a lack of localization of dystrophin to the myoseptae, and an associated disruption of muscle cell morphology.31,32 Numerous reports indicate that resting levels of [Ca2+]i might be abnormally high in dystrophin-deficient cultured muscle cells, and it was suggested that this might be an important cause of the pathophysiological process leading to dysfunction and ultimately to cell death.33-41 Very little, however, is known about the consequence of an absence or deletion of dystrophin on early myogenic Ca2+ signalling. In this paper, we present some of the first evidence to suggest that the absence of dystrophin has a significant effect on the early myogenic Ca2+ signalling in zebrafish embryos. Our data also support the view that intact zebrafish offer a very amenable system for investigating muscle development at the Ca2+ signalling, gene-expression, protein, cellular and whole system levels, when compared with the in utero mouse or other in vitro systems.32,42
We used the following strains of zebrafish (Danio rerio): the wild-type AB strain (from the Zebrafish International Resource Centre; University of Oregon, Eugene, OR, USA); the α-actin-apoaequorin-IRES-EGFP (α-actin-aeq) transgenic line,15 and the sapje mutant line (obtained from the Tübingen stock collection at the Max-Planck-Institut für Entwicklungsbiologie). They were all maintained on a 14 h light/ 10 h dark cycle to stimulate spawning,43 and their fertilized eggs were collected as described elsewhere.44 Embryos were maintained in 30% Danieau’s solution (17.4 mM NaCl, 0.21 mM KCl, 0.18 mM Ca(NO3)2, 0.12 mM MgSO4.7H2O, 1.5 mM Hepes, pH 7.2) at ∼28.5°C throughout development and during all experiments.
Preparation of the pα-KS-aeq-IRES-EGFP plasmid and its subsequent use in the generation of the α-actin-aeq transgenic zebrafish are described in detail in Cheung et al.15 The α-actin-aeq transgenic embryos were dechorionated manually with watchmaker’s forceps at the 8-cell stage and then incubated with 50 μM f-coelenterazine (Molecular Probes, Invitrogen Corp., Carlsbad, CA, USA) in 30% Danieau’s solution to reconstitute the active holoaequorin. f-coelenterazine was prepared as a stock solution of 5 mM in 100% methanol and was diluted in 30% Danieau’s solution just prior to use. Embryos were held in place in a custom-designed imaging chamber and transferred to a custom-built Photon Imaging Microscope System (PIMS; Science Wares, East Falmouth, MA, USA) for data acquisition from ∼16 to 24 hpf (i.e. the 15- to 30-somite stage) at ∼28.5°C. An outline of the PIMS and the photon acquisition procedure is described by Webb et al.44
DNA sequencing was applied to maintain the sapje mutant line and to retrospectively identify the exact genotype of the mutant embryos used for experiments. Exon 4 of the dmd gene was amplified from genomic DNA prepared from either the caudal fin of a single adult fish or a single embryo at 3 days post-fertilization (dpf) using the following oligonucleotide primers: 5′-tttggctctgctgtattctggtta-3′ and 5′-gccagtgaaatggataagtgtcatta-3′ (designed by Dr. Martial D.A. Jaume, HKUST). The PCR product was purified using the QIAquick® PCR purification kit (Qiagen Ltd., NQ, UK) following the protocol recommended by the manufacturer, and then sequenced to confirm the presence of the point mutation (i.e. the A to T transversion) in exon 4 of the dmd gene that was reported by Bassett et al.31
In some experiments apoaequorin was transiently expressed in sapje mutant embryos by injecting ∼1 nl aeq-mRNA (at a concentration of ∼500 pg/nl, prepared in nuclease-free water) into the center of the yolk at the 1-cell stage following protocols described by Cheung et al.45 Holoaequorin was then reconstituted in the aeq-mRNA injected embryos by incubation in 50 μM f-coelenterazine solution and spatial and temporal luminescence data was acquired via the PIMS, as described previously. Imaged embryos were subsequently identified either by PCR at 3 dpf or phenotype at 4 dpf.
In these experiments, approximately 2 nl of f-holoaequorin was microinjected into embryos at the 1-cell stage as described in detail previously.44,46,47 In order to be able to compare aequorin-generated data from different embryos in subsequent data analysis procedures, we followed a strict experimental protocol where injection volumes were calibrated before injection, and injection micropipettes were broken and beveled to produce a consistent tip shape and dimension. This results in each embryo being loaded with the same volume of holoaequorin injectate in addition to being subjected to similar injection trauma. Furthermore, experimental embryos used for comparison were injected with aequorin from the same aliquot.44, 46,47
Embryos were then injected with ∼3 ng of either dmd- or control-morpholino (MO) at ∼35 min post fertilization (i.e. when the first cleavage furrow just started to form). The dmd-MO (5′-aaagcgaaagcacctgtggctgtgg-3′) and control-MO (5′-cctcttacctcagttacaatttata-3′) were purchased from GeneTools and 1 mM stock solutions were prepared in milliQ water.
The temporal profile of luminescence generated by these embryos between ∼12 to ∼24 hpf was detected and recorded using a custom-built photon-multiplier tube (PMT) platform consisting of a P10PC PMT (Electron Tube Limited) mounted in a dark box (supplied by Science Wares Inc, East Falmouth, MA, USA). At the end of each experiment, Triton X-100 was added to the embryo bathing medium to “burn-out” all remaining aequorin and thus determine whether the signals recorded had been aequorin-limited. Bright-field images of dmd-MO and control-MO-injected embryos at 4 dpf were captured for morphometric observations using a Nikon DXM 1200F camera mounted on a Zeiss Axioskop microscope with a Zeiss Achroplan 40×/0.75 NA water-immersion objective lens.
The calcium green-1 dextran-based fluorescent confocal imaging experiments were performed as described by Cheung et al.15
Embryos were microinjected with the dmd-MO or control-MO as described previously. Embryos were dechorionated manually using watchmaker’s forceps just prior to fixation at 17 hpf, 19 hpf, 22 hpf and 26 hpf with 4% paraformaldehyde and 4% sucrose in phosphate-buffered solution (PBS; 0.8% NaCl, 0.02% KCl, 0.02M PO4 buffer; pH 7.3)43 at 4°C overnight. Embryos were then washed thoroughly with PBS, after which they were incubated with PBS containing 1% Triton X-100 (PBT) for 5 min and then with PBT containing 1% DMSO (PBTD) at room temperature for 1 h. The embryos were then transferred to blocking buffer (10% goat serum and 1% BSA in PBTD) and incubated for 2 h at room temperature after which they were incubated with the anti-dystrophin antibody, MANDRA-1 (Sigma; used at a dilution of 1:200 dilution in blocking buffer) overnight at 4°C. Embryos were washed extensively with PBTD containing 1% BSA before being transferred to Alexa Fluor 488-tagged goat anti-mouse IgG (Invitrogen; used at 1:200 in blocking buffer), and Alexa Fluor 568-phalloidin (Invitrogen; at 1:200 in blocking buffer) to label F-actin. Embryos were incubated with the secondary antibody and the Alexa Fluor-tagged phalloidin simultaneously for 2 h at room temperature in the dark, followed by extensive washes with PBT and then PBS. The embryonic yolk was then removed manually using a tungsten needle and the embryos were mounted under coverslips (No. 1.5H; Marienfeld GmbH & Co. KG).
In some experiments, untreated wild-type embryos were fixed at 3 dpf and incubated with the MANDRA-1 anti-dystrophin primary antibody as described previously. They were then labeled with Atto647N-tagged goat anti-mouse IgG (Active Motif; used at 1:10 in blocking buffer) for subsequent STED imaging, and AlexaFluor 488-phalloidin (Invitrogen; at 1:100 in blocking buffer) to visualize F-actin.
Laser scanning confocal microscopy and stimulated emission depletion (STED) microscopy48 were carried out using a Leica TCS SP5 STED super-resolution confocal laser scanning system equipped with a Leica DMI 6000 motorized inverted microscope. Alexa Fluor 488 and Alexa Fluor 568 fluorescence was visualized by excitation with argon 488 nm and DSPP 561 nm lasers, respectively. For regular confocal imaging, Atto647N fluorescence was visualized by excitation with a pulsed 635 nm diode laser. For STED imaging, Atto647N was depleted using a Titan Sapphire femtosecond infrared laser (Coherent, Chameleon Ultra II), which was tuned to 765 nm and full power was applied, and an avalanche photodiode (APD) was used for detection. All images were acquired using a Leica HCX PL APO CS 100×/1.40 NA oil-immersion objective lens. STED images were acquired using a 5× zoom.
BODIPY FL C5-ceramide (Molecular Probes) was prepared as a 5 mM stock solution in DMSO and was diluted to 100 μM in 30% Danieau’s solution just prior to use. Wild-type and sapje mutant embryos at 4 dpf, were incubated in BODIPY FL C5-ceramide for ∼60 min, after which fluorescence was visualized with a Nikon C1 laser scanning confocal system mounted on a Nikon Eclipse 90i upright microscope. BODIPY FL C5-ceramide-generated fluorescence was acquired using 488 nm excitation and 515-530 nm emission filters, and images were acquired using a Nikon Fluor 40×/0.8 NA water-immersion objective lens.
We recently developed stable lines of transgenic zebrafish that express apoaequorin specifically targeted to skeletal muscle cells in order to improve the spatial resolution (especially in 3-D) of our aequorin-based imaging methodology.15 As described previously, transgenic embryos were incubated in f-coelenterazine to reconstitute active holoaequorin and the Ca2+ signals generated between ∼17 hpf and 27 hpf were visualized with the PIMS (Figure 1A*).15 Using a region of interest covering the whole embryo, temporal luminescent data was plotted in photons/s against time (Figure 1A). Two distinct periods of spontaneous, synchronized Ca2+ signals (with characteristic frequencies and durations, as well as locations), which we termed “Signalling Period 1” (SP1) and “Signalling Period 2” (SP2), were visualized in the trunk of intact embryos between ∼17.5 to 19.5 hpf and after ∼23 hpf, respectively (Figure 1A).15
Each period had characteristic frequencies and durations, as well as locations. With regards to SP1, the frequencies ranged between ∼0.02 – 0.03 Hz at the start (i.e. ∼17.5 – 18 hpf) and end (i.e. ∼19 – 19.5 hpf) of this signalling period and ∼0.13 Hz in the middle (i.e. ∼18.5 – 19 hpf) of SP1, while the duration of the Ca2+ signals ranged between ∼0.4 to 0.8 s for the entire SP1. With regards to SP2, the frequencies were maintained at ∼ 0.03 Hz for the entire period imaged (i.e. ∼23 – 24.5 hpf) and the duration of the Ca2+ signals was ∼0.6 s. With regards to the location of the Ca2+ signals, at the start of the SP1 (i.e. at ∼17.5 hpf), Ca2+ signals were generated only between somites 4 to 10 of the 17-somite stage embryo, whereas an hour later (i.e. at ∼18.5 hpf) the signals arose in somites 2 to 12. These data are described in further detail in Cheung et al.15
In addition to this most recent report by Cheung et al.,15 the generation of Ca2+ signals in the trunk between ∼17 hpf and ∼24 hpf have also been reported previously both with holoaequorin45,49,50 and with the fluorescent Ca2+ reporter, Oregon green 488 BAPTA-dextran.7 In the case of the latter, Brennan et al.7 characterized (from a temporal perspective) what they described as a series of “nerve-mediated Ca2+ signals” that were generated in the slow muscle cells of zebrafish from ∼17 to 22 hpf. In addition, the appearance and duration of SP1 correlates well with the first of three different types of zebrafish movement behavior reported by Saint-Amant and Drapeau.25 This takes the form of spontaneous, alternating left-to-right slow contractions of the trunk and tail, which were reported to begin suddenly at ∼17 hpf.25
SP1 ends at ∼20 hpf as the muscle cells enter into a quiet period (QP in Figure 1A) with regards to Ca2+ signalling activity. This quiet period lasts for ∼3.5 h (i.e. from ∼20 to 23 hpf) and it appears to coincide with a period of significant Ca2+ signalling activity in the developing zebrafish spinal cord, which is reported to occur between ∼19 to ∼23 hpf.51
Once the location and timing were established via aequorin-based imaging, individual Ca2+ signals were further characterized with respect to their sub-cellular spatial signatures by utilizing the fluorescent Ca2+ reporter, calcium green-1 dextran (10 kDa), in conjunction with higher resolution confocal microscopy (Figure 1B-D).15 The morphology and confocal location of the cells generating the Ca2+ signals, revealed that these signals were restricted to slow muscle cells. At ∼17.5 hpf, the Ca2+ signals appeared to be generated mainly in and around the nucleus, with relatively little spread into the cytoplasm (Figure 1B; see red arrowheads). At ∼18.5 hpf, however, it is clear that although nuclear signalling was still a prominent feature, a second distinct set of Ca2+ signals also propagated out into the cytosolic fraction of each slow muscle cell (Figure 1C). Thus, the SP1 Ca2+ signals had distinct nuclear and cytoplasmic components. In addition, the SP1 signals were shown to be synchronous with respect to consecutive groups of anterior somites (e.g. S7 to S10)15 and to coincide with the earliest, spontaneous contractions of the embryonic trunk.24,25
The dual nature of the slow muscle cell Ca2+ signals at ∼18 hpf bear a similarity to aspects of Ca2+ signals induced by elevated K+ in cultured rat and mouse myotubes.5,52 In these cultured muscle cells, two types of Ca2+ transient, with different cellular domains and kinetics were identified. One was a fast cytoplasmic Ca2+ transient, which was associated with ryanodine receptors (RyRs) and excitation-contraction coupling. Following this fast transient was a slower nuclear Ca2+ transient, which resulted in an increase in nucleoplasmic Ca2+ (that lasted in the range of 30-40 s), but not in muscle cell contraction. In addition, it has been reported that treatment of rat and mouse myotubes with nifedipine or 2-APB completely blocked the slow nucleoplasmic transient, thus it was suggested that dihydropyridine receptors might be the main membrane voltage sensor that initiates this Ca2+ signal, and that the main component of the signal is generated by Ca2+ release from internal stores via IP3Rs.5,14 Furthermore, the slow IP3R-mediated Ca2+ transient in rat and mouse myotubes was reported to be linked to developmental gene expression, where K+-induced depolarization of mouse myotubes resulted in the rapid (i.e. within 30 s-10 min) phosphorylation of the mitogen activated kinases, ERK 1/2 and the transcription factor, CREB, as well as the expression (within 5 – 15 min) of various early genes.5,14,53,54 Thus, we suggest that the early Ca2+ oscillations located in and around the nucleus of zebrafish slow muscle cells at ∼17.5 and 18.5 hpf (Figure 1B and C) may play a role in gene expression, whereas the cytoplasmic phase of the slow muscle cell-generated signals at ∼18.5 hpf (Figure 1C) might play a role in the excitation-contraction coupling of the trunk muscle, resulting in the spontaneous slow contractions of the trunk and tail described by Saint-Amant and Drapeau.25 In the case of the SP2 Ca2+ signals, on the other hand, we did not visualize any specific nuclear component, as the SP2 signals consisted exclusively of cytoplasmic signals (Figure 1D). Furthermore, their appearance correlated with that of a second phase of stronger contractions of the trunk that were reported by Saint-Amant and Drapeau.25 We suggest therefore that the SP2 signals are largely involved in excitation-contraction coupling of the trunk muscle.
Data acquired following the treatment of embryos with specific Ca2+ channel antagonists suggest that the signals generated by different Ca2+-release mechanisms may have separate developmental functions within differentiating slow muscle cells.15 For example, treatment with ryanodine but not 2-APB caused severe disruption of myofibres, often resulting in complete detachment of slow muscle cells from the vertical myoseptae.15 This latter observation is of particular interest as it suggests that myogenic Ca2+ signalling may also play a key role in myoseptal junction formation and maintenance in zebrafish. Our preliminary data suggest that dystrophin becomes localized at the vertical myosepta (Figure 1E,F) at the same time as the SP1 transients are generated (i.e. at ∼17.5 hpf to 19 hpf), and the spontaneous slow muscle cell-generated coiling contractions are initiated.25 Between 22 hpf and 26 hpf, the expression of dystrophin in the vertical myosepta then becomes a lot more prominent (Figure 1G-H), i.e. when the stronger contractions of the trunk are reported to start.25
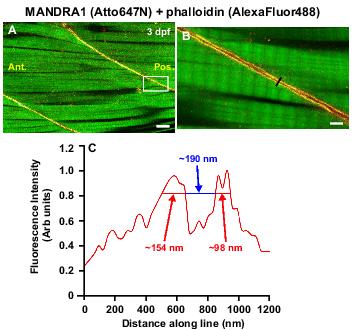
Figure 2. Visualization of dystrophin in the vertical myosepta of wild-type zebrafish embryos at 3 dpf. Dystrophin was labeled with the MANDRA-1 anti-dystrophin 1° antibody and an Atto647N-tagged 2°antibody, and F-actin was labeled with AlexaFluor 488-tagged phalloidin. AlexaFLuor 488 fluorescence was visualized at (A) low and (B) high magnification via normal confocal microscopy. Atto647N fluorescence was visualized (A) at low magnification with normal confocal microscopy and (B) at high magnification via STED microscopy. The region within the white box in (A) is shown at higher magnification in (B). C: Graph of the relative fluorescence intensity along the region of interest shown by the black line in panel (B). Scale bars, (A) 10 μm and (B) 2 μm. Ant. and Pos are anterior and posterior, respectively.
The localization of dystrophin was also visualized in 3 dpf embryos via both regular confocal (Figure 2A) and stimulated emission depletion (STED; Figure 2B) microscopy. The latter, super-resolution imaging technique clearly shows two distinct regions of dystrophin localization of ∼100-150 nm width at the slow muscle cell/myoseptal boundary in adjacent myotomes, that are separated by a fluorescence-free region of ∼190 nm (Figure 2C). Our data indicate that we are able to achieve a degree of subdiffraction resolution within the intact muscle of a fixed zebrafish embryo. These are most encouraging results and they serve to demonstrate the potential of applying this powerful technique to intact embryos.
When embryos were injected with the standard Gene Tools control-MO, somewhat similar dystrophin localization results were obtained (Figure 3) when compared with those in wild-type embryos (Figure 1E-H). Thus, dystrophin was diffusely localized throughout the myotome at ∼17 hpf (Figure 3A) and then it became concentrated in the vertical myoseptae at ∼19 hpf (see white arrowheads in Figure 3B and compare this with the onset of dystrophin expression in the untreated control embryo in Figure 1F).
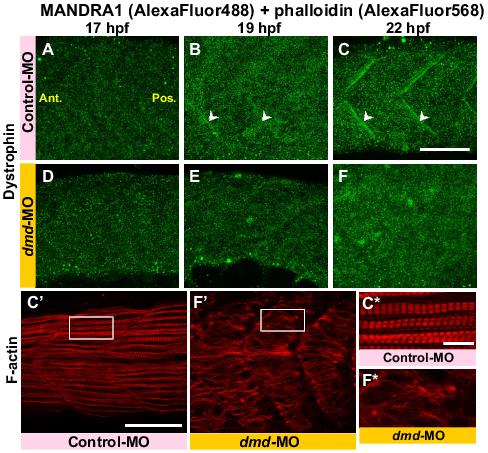
Figure 3. Effect of dmd-MO on the localization of dystrophin, morphology of the slow muscle cells and organization of the sarcomeres. Embryos were injected with either control-MO (A-C, C′) or dmd-MO (D-F, F′) at the single cell stage. They were then fixed at 17 hpf (A, D) 19 hpf (B, E) or 22 hpf (C, C′, F, F′), after which dystrophin and F-actin were labeled via immunolabeling with the MANDRA1 antibody (A-F) and phalloidin (C′,F′), respectively. The region bounded by the white square in panels C′ and F′ are enlarged in panels C* and F*. White arrowheads in panels B and C indicate dystrophin localized in the vertical myoseptae. Ant. and Pos. are anterior and posterior, respectively. Scale bars, (A-F,C′,F′), 50 μm; (C*,F*) 10 μm.
Dystrophin expression was more prominent in the vertical myoseptae at ∼22 hpf (see white arrowheads in Figure 3C). In addition, Alexa Fluor 568-phalloidin labeling of F-actin revealed that the formation of the slow muscle cells and sarcomeres was normal (see Figure 3C′ and 3C*). On the other hand, when embryos were injected with a well-characterized dmd-MO,31 there was no localization of dystrophin in the vertical myoseptae at any of the times analysed (Figure 3D-F). In addition, in the dmd-MO-injected embryos, myotome morphology, myofibre development and sarcomere formation, as demonstrated by Alexa Fluor 568-phalloidin labeling, was also disrupted when compared with the control-MO-injected embryos (i.e. compare Figure 3F′ with 3C′ and Figure 3F* with 3C*). In the representative images shown here in Figure 3, the mean ± S.E.M. myofibre length of n = 10 regions in the control-MO-injected embryo was 60.88 ± 0.76 μm, whereas that in the dmd-MO-injected embryo was 38.30 ± 2.47 μm; thus there was an approximate 2-fold decrease in myofibre length in the dmd-MO-injected embryo. Furthermore, the length of the inter-vertical myoseptal gap in the control-MO-injected embryo was 0.21 ± 0.01 μm, whereas that in the dmd-MO-injected embryo was 7.11 ± 1.51 μm; thus there was over a 30-fold increase in this distance in the dmd-MO-injected embryo. These results suggest that, as reported in other systems, dystrophin may play a key role in linking the F-actin to the extracellular matrix via the dystroglycan complex, hence the significant increase in the distance between the ends of the adjacent myofibres in the dmd-MO-injected embryos.32,55
We also undertook a series of experiments to characterize the myogenic Ca2+ signalling signatures in dystrophin-deficient embryos. We adopted a 2-fold strategy (i.e. both molecular and genetic) where we imaged: (1) wild-type embryos injected with f-holoaequorin and either the dmd-MO31 (n = 3) or the control-MO (n = 3; Figure 4); and (2) sapje mutant embryos injected with aeq-mRNA (n = 11 embryos, where two were subsequently shown to be homozygous and one heterozygous for the sapje mutation; Figure 5).
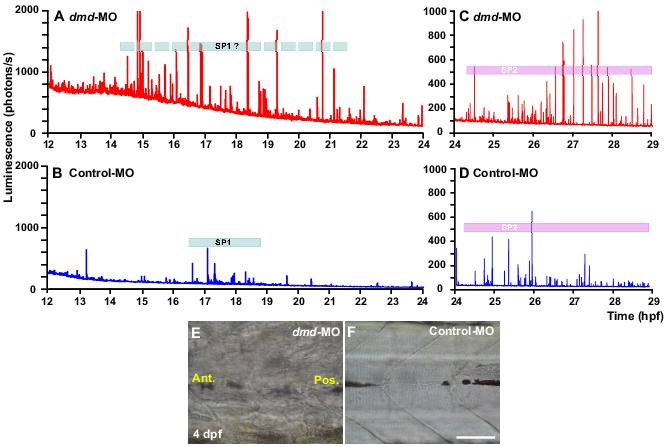
Figure 4. Effect of dmd-morpholino (MO) on the SP1 and SP2 Ca2+ signals and myotome morphology. A-D: Representative embryos were injected with f-holoaequorin and either dmd-MO (A and C; n=3) or control-MO (B and D; n=3). The pattern of Ca2+ signals generated from 12 hpf to 24 hpf (A and B), and from 24 hpf to 29 hpf (C and D), are shown. The Ca2+ signals generated in embryos injected with control-MO (B and D) were very similar to those reported from uninjected wild-type embryos,15 i.e. with two well-defined Ca2+ signalling periods (SP1 and SP2). On the other hand, when embryos were injected with dmd-MO (A and C), the period of SP1 Ca2+ signal generation was far less well-defined than that observed in the control-MO-injected embryos (compare A with B). In addition, the signals generated during both SP1 and SP2 were at a higher frequency and a higher amplitude than those generated in the control-MO-injected embryos. The dmd-MO-injected embryos also displayed a significant increase in the resting level of Ca2+ when compared with the controls. E&F: Effect of the dmd-MO on myotome morphology. Representative bright-field images of the trunk of embryos at 4 dpf, following injection with dmd-MO (E) or control-MO (F). Ant. and Pos. are anterior and posterior, respectively. Scale bar, 50 μm.
Figure 4A-D shows the Ca2+ imaging data acquired between ∼12-29 hpf of two representative embryos that were injected with either (A and C) dmd-MO or (B and D) control-MO (n=3 for each type of morpholino). Our preliminary data indicate that the Ca2+ signalling signature of the dmd-MO-injected embryos is altered with regards to the number of transients generated as well as their amplitude and timing, when compared with the control-MO-injected embryos. This is especially obvious with regards to the SP1 Ca2+ signals. In the example shown in Figure 4, the resting level of Ca2+ in the dmd-MO-injected embryos appears to be approximately double that in the control-MO-injected embryos. As these traces were obtained following injection of holoaequorin (protein) into embryos at the one-cell stage (i.e. shortly after fertilization), we suggest that the decline in luminescence background is most probably related to aequorin utilization.45 In addition, SP1 in the control-MO example shown here (Figure 4C) occurs between ∼16.5 and 18.5 hpf, which is somewhat similar to that observed in wild-type embryos (see Figure 1A and Cheung et al.,15) and in this example there are ∼20 Ca2+ transients. However, there appear to be more Ca2+ signals (i.e. 30 Ca2+ transients in this example) generated in the dmd-MO-injected embryos. In addition, the Ca2+ signals generated in the dmd-MO-injected embryos start earlier (i.e. at ∼14.5 hpf) and end later (i.e. at ∼21-22 hpf) than do the SP1 signals in the controls. Furthermore, the amplitude of the Ca2+ signals in the dmd-MO-injected embryo ranges between ∼100 to ∼2300 photons/s above the background level of signal, with an average amplitude of ∼700 photons/s, whereas in the control, the amplitude ranges between ∼8 to ∼580 photons/s above background, with an average of ∼120 photons/s. With regards to the SP2 Ca2+ signals, again the number and amplitude of the transients generated in the dmd-MO-injected embryo is clearly higher than the control-MO-injected embryo. It should be noted that we did not include the Ca2+ transient generated at ∼13 hpf in the control-MO-injected embryo in our SP1 calculations as we suggest that this is one of the stochastic Ca2+ signals that are reported to occur in the somites and notochord during the early segmentation period, when the somites are first forming.56 We do not yet have any spatial Ca2+ imaging data to add to these temporal traces, to show where the Ca2+ transients are generated in the morpholino-injected embryos, these experiments will be done in the near future. However, the increased Ca2+ signalling activity in the dmd-MO-injected embryos does appear to coincide with altered morphology of the forming muscles, as indicated by the dystrophin and F-actin-labeling data acquired at 22 hpf (see Figure 2). The effect of the dmd-MO and control-MO on the morphology of the myotome is also shown at 4 dpf (Figure 4E,F).
Figure 5 shows examples of the Ca2+ signalling signatures from one homozygous (Figure 5A) and one heterozygous (Figure 5B) sapje mutant embryo. Sapje is a recessive lethal mutation such that homozygous individuals do not survive beyond a few weeks and myotomal lesions are apparent as early as 2 dpf.31 On the other hand, the muscle cells of heterozygous fish develop normally, without lesions.57 With regards to our preliminary data shown here, the Ca2+ signalling signature of the homozygous sapje mutant, which was retrospectively identified by the lesions observed at 4 dpf (Figure 5C), was altered in a somewhat similar manner (i.e. with respect to number of transients generated, as well as their amplitude and timing) as the embryos injected with dmd-MO (compare Figure 5A with Figure 4A). On the other hand, the Ca2+ signalling signature of the heterozygous sapje mutant (Figure 5B), which was identified by PCR, shows what appears to be a clearly defined SP1, which is similar to that observed in embryos injected with control-MO (Figure 4B) and in wild-type embryos (Figure 1A). We suggest that the Ca2+ transients generated in the heterozygous sapje mutants between ∼12 and 14 hpf (Figure 5B; i.e. before the first spontaneous trunk contractions are reported)25 might again represent somite-generated stochastic Ca2+ signals that occur during the early segmentation period.56
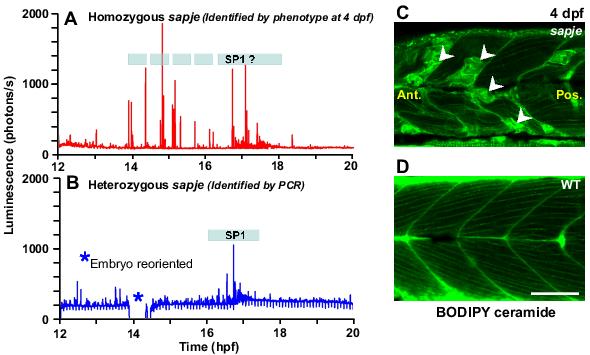
Figure 5. An altered pattern of Ca2+ signalling and disruption of the normal myotome morphology is observed in homozygous sapje embryos. A&B: These are preliminary data from two embryos, (A) a homozygous and (B) a heterozygous sapje embryo that were injected with aeq-mRNA at the single cell stage and then incubated with f-coelenterazine from the 64-cell stage to reconstitute active aequorin in the embryo. The Ca2+ signals generated in the heterozygous embryo between 12 hpf to 20 hpf were very similar to those reported from uninjected wild-type embryos,15 i.e. with a well-defined Ca2+ signalling period (SP1), which started at ∼17 hpf. In the homozygous sapje embryo, however, the SP1 Ca2+ signals were far less well-defined and were generated at a higher frequency and a higher amplitude than those generated in the heterozygous embryo. C&D: Myotome morphology of (C) a representative sapje mutant and (D) wild-type (WT) embryos, which were labeled with BODIPY FL C5-ceramide at 4 dpf. The myotomal lesions, which occur in the sapje mutants, are indicated by white arrowheads in panel C. Ant. and Pos. are anterior and posterior, respectively. Scale bar, 50 μm.
In summary, our new data provide the first evidence that dystrophin may play an important role not just in mature muscle function, but also in muscle differentiation, myotube attachment and early sarcomeric contraction within intact zebrafish. The detrimental effect of a lack of dystrophin at later stages of zebrafish development (i.e. over 2 days post-fertilization) and in adult fish, where both slow and fast skeletal muscles are fully developed, have been widely reported.31,58,59 Our new data, however, are the first to suggest that dystrophin may function at the very earliest stage of slow muscle cell differentiation when the appearance of Ca2+ signals in these cells coincides with the earliest spontaneous contractions of the zebrafish trunk (see time-line in Figure 1).15,25
We thank Osamu Shimomura for supplying the f-holoaequorin used in the morpholino experiments. We would also like to thank Anming Meng (Tsinghua University, Beijing, PRC) and Frederick I. Tsuji (Scripps Institution of Oceanography, University of California San Diego, USA) for providing us with the αp-SK and piP-HE plasmids, respectively. We acknowledge financial support from the Hong Kong Research Grants Council GRF award: HKUST662109, from the Hong Kong University Grants Committee award: SEG_HKUST01, and from the Royal Society International Joint Project Award 2010/R1. Fish were supplied by the Zebrafish International Resource Center, supported by grant #RR12546 from the NIH-NCRR.
1. Flucher BE, Andrews SB. Characterization of spontaneous and action potential-induced calcium transients in developing myotubes in vitro. Cell Motil. Cytoskel. 1993; 25: 143-157.
2. Ferrari MB, Rohrbough J, Spitzer NC. Spontaneous calcium transients regulate myofibrillogenesis in embryonic Xenopus myocytes. Dev. Biol. 1996; 178: 484-497.
3. Lorenzon P, Giovannelli A, Ragozzino D, Eusebi F, Ruzzier F. Spontaneous and repetitive calcium transients in C2C12 mouse myotubes during in vivo myogenesis. Eur. J. Neurosci. 1997; 9: 800-808.
4. Ferrari MB, Spitzer NC. Calcium signaling in the developing Xenopus myotome. Dev. Biol. 1999; 213: 269-282.
5. Powell JA, Carrasco MA, Adams DS, Drouet B, Rios J, Müller M, Estrada M, Jaimovich E. IP3 receptor function and localization in myotubes: an unexplored Ca2+ signaling pathway in skeletal muscle. J. Cell Sci. 2001; 114: 3673-3683.
6. Li H, Cook JD, Terry M, Spitzer NG, Ferrari MB. Calcium transients regulate patterned actin assembly during myofibrillogenesis. Dev. Dyn. 2004; 229: 231-242.
7. Brennan C, Mangoli M, Dyer CEF, Ashworth R. Acetylcholine and calcium signaling regulates muscle fibre formation in the zebrafish embryo. J. Cell Sci. 2005; 118: 5181-5190.
8. Campbell NR, Podugu SP, Ferrari MB. Spatiotemporal characterization of short versus long duration calcium transients in embryonic muscle and their role in myofibrillogenesis. Dev. Biol. 2006; 292: 253-264.
9. Fujita H, Nedachi T, Kanzaki M. Accelerated de novo sarcomere assembly by electric pulse stimulation in C2C12 myotubes. Exp. Cell Res. 2007; 313: 1853-1865.
10. Berchtold MW, Brinkmeier H, Müntener M. Calcium ion in skeletal muscle: Its crucial role for muscle function, plasticity, and disease. Physiol. Rev. 2000; 80: 1215-1265.
11. Ferrari MB, Podugu S, Eskew JD. Assembling the myofibril - Coordinating contractile cable construction with calcium. Cell Biochem. Biophys. 2006; 45: 317-337.
12. Al-Shanti N, Stewart CE. Ca2+/calmodulin-dependent transcriptional pathways: potential mediators of skeletal muscle growth and development. Biol. Rev. 2009; 84: 637-652.
13. Webb SE, Miller AL. Visualization of Ca2+ signaling during embryonic skeletal muscle formation in vertebrates. CSH Perspect. Biol. 2010; doi:10.1101/cshperspect.a004325.
14. Jaimovich E, Carrasco MA. IP3 dependent Ca2+ signals in muscle cells are involved in regulation of gene expression. Biol. Res. 2002; 35: 195-202.
15. Cheung CY, Webb SE, Love DR, Miller AL. Visualization, characterization and modulation of Ca2+ signaling during the development of slow muscle cells in intact zebrafish embryos. Int. J. Dev. Biol. 2011; 55: 153-174.
16. Weinberg ES, Allende ML, Kelly CS, Abdelhamid A, Murakami T, Andermann P, Doerre OG, Grunwald DJ, Riggleman B. Developmental regulation of zebrafish MyoD in wild-type, no tail and spadetail embryos. Development 1996; 122: 271-280.
17. Brennan C, Amacher SL, Currie PD. IV. Aspects of organogenesis: Somitogenesis. Res. Probl. Cell Differ. 2002; 40: 271-297.
18. Ochi H, Westerfield M. Signaling networks that regulate muscle development: Lessons from zebrafish. Develop. Growth Differ. 2007; 49: 1-11.
19. Blagden CS, Currie PD, Ingham PW, Hughes SM. Notochord induction of zebrafish slow muscle mediated by Sonic hedgehog. Genes Dev. 1997; 11: 2163-2175.
20. Devoto SH, Melançon E, Eisen JS, Westerfield M. Identification of separate slow and fast muscle precursor cells in vivo, prior to somite formation. Development 1996; 122: 3371-3780.
21. Barresi MJ, D’Angelo JA, Hernández LP, Devoto SH. Distinct mechanisms regulate slow-muscle development. Curr. Biol. 2001; 11: 1432-1438.
22. Du SJ, Devoto SH, Westerfield M, Moon RT. Positive and negative regulation of muscle cell identity by members of the hedgehog and TGF-β gene families. J. Cell Biol. 1997; 139: 145-156.
23. Myers PZ, Eisen JS, Westerfield M. Development and axonal outgrowth of identified motoneurons in the zebrafish. J. Neurosci. 1986; 6: 2278-2289.
24. Liu DW, Westerfield M. Clustering of muscle acetylcholine receptors requires motoneurons in live embryos, but not in cell culture. J. Neurosci. 1992; 12: 1859-1866.
25. Saint-Amant L, Drapeau P. Time course of the development of motor behaviors in the zebrafish embryo. J. Neurobiol. 1998; 37: 622-632.
26. Horikawa K, Yamada Y, Matsuda T, Kobayashi K, Hashimoto M, Matsu-ura T, Miyawaki A, Michikawa T, Mikoshiba K, Nagai T. Spontaneous network activity visualized by ultrasensitive Ca2+ indicators, yellow Cameleon-Nano. Nature Methods 2010; 7: 729-732.
27. Barresi MJ, Stickney HL, Devoto S. The zebrafish slow-muscle-omitted gene product is required for Hedgehog signal transduction and the development of slow muscle identity. Development 2000; 127: 2189-2199.
28. Chen JK, Taipale J, Cooper MK, Beachy PA. Inhibition of Hedgehog signaling by direct binding of cyclopamine to Smoothened. Genes Dev. 2002; 16: 2743-2748.
29. Claflin DR, Brooks SV. Direct observation of failing fibers in muscles of dystrophic mice provides mechanistic insight into muscular dystrophy. Am. J. Physiol. Cell Physiol. 2008; 294: 651-658.
30. Chambers SP, Anderson LV, Maguire GM, Dodd A, Love DR. Sarcoglycans of the zebrafish: orthology and localization to the sarcolemma and myosepta of muscle. Biochem. Biophys. Res. Commun. 2003; 303: 488-495.
31. Bassett DI, Bryson-Richardson RJ, Daggett DF, Gautier P, Keenan DG, Currie PD. Dystrophin is required for the formation of stable muscle attachments in the zebrafish embryo. Development 2003; 130: 5851-5860.
32. Guyon JR, Mosley AN, Zhou Y, O'Brien KF, Sheng X, Chiang K, Davidson AJ, Volinski JM, Zon LI, Kunkel LM. The dystrophin associated protein complex in zebrafish. Hum. Mol. Genet. 2003; 12: 601-615.
33. Alderton JM, Steinhardt RA. Calcium influx through calcium leak channels is responsible for the elevated levels of calcium-dependent proteolysis in dystrophic myotubes. J. Biol. Chem. 2000; 275: 9452-9460.
34. Mallouk N, Jacquemond V, Allard B. Elevated subsarcolemmal Ca2+ in mdx mouse skeletal muscle fibers detected with Ca2+-activated K+ channels. Proc. Natl. Acad. Sci. USA 2000; 97: 4950-4955.
35. Robert V, Massimino ML, Tosello V, Cantini M, Sorrentino V, Pozzan T. Alteration in calcium handling at the subcellular level in mdx myotubes. J. Biol. Chem. 2001; 276: 4647-4651.
36. Vandebrouck C, Martin D, Colson-Van Schoor M, Debaix H, Gailly P. Involvement of TRPC in the abnormal calcium influx observed in dystrophic (mdx) mouse skeletal muscle fibers. J. Cell Biol. 2002; 158: 1089-1096.
37. Basset O, Boittin F-X, Dorchies OM, Chatton J-Y, van Breemen C, Ruegg UT. Involvement of inositol 1,4,5-trisphosphate in nicotinic calcium responses in dystrophic myotubes assessed by near-plasma membrane calcium measurement. J. Biol. Chem. 2004; 179: 47092-47100.
38. Basset O, Boittin F-X, Cognard C, Constantin B, Ruegg UT. Bcl-2 overexpression prevents calcium overload and subsequent apoptosis in dystrophic myotubes. Biochem. J. 2006; 395: 267-276.
39. Boittin F-X, Shapovalov G, Hirn C, Ruegg UT. Phospholipase A2-derived lysophosphatidylcholine triggers Ca2+ entry into dystrophic skeletal muscle fibres. Biochem. Biophys. Res. Comm. 2010; 391: 401-406.
40. Cárdenas C, Juretić N, Bevilacqua JA, García IE, Figueroa R, Hartley R, Taratuto AL, Gejman R, Riveros N, Molgó J, Jaimovich E. Abnormal distribution of inositol 1,4,5-trisphosphate receptors in human muscle can be related to altered calcium signals and gene expression in Duchenne dystrophy-derived cells. FASEB J. 2010; 24: 3210-3221.
41. Head SI. Branched fibres in old dystrophic mdx muscle are associated with mechanical weakening of the sarcolemma, abnormal Ca2+ transients and a breakdown of Ca2+ homeostasis during fatigue. Exp. Physiol. 2010; 95: 641-656.
42. Dodd A, Greenwood DR, Miller AL, Webb SE, Chambers SP, Copp BR, Love DR. Zebrafish: at the nexus of functional and chemical genetics. Biotech. Gen. Eng. Rev. 2006; 22: 77-99.
43. Westerfield M. The Zebrafish Book: A Guide for the Laboratory Use of Zebrafish (Brachydanio rerio). Univ. of Oregon Press, Eugene, OR. 1994.
44. Webb SE, Lee KW, Karplus E, Miller AL. Localized calcium transients accompany furrow positioning, propagation, and deepening during the early cleavage period of zebrafish embryos. Dev. Biol. 1997; 192: 78-92.
45. Cheung CY, Webb SE, Meng A, Miller AL. Transient expression of apoaequorin in zebrafish embryos: extending the ability to image calcium transients during later stages of development. Int. J. Dev. Biol. 2006; 50: 561-569.
46. Miller AL, Karplus E, Jaffe LF. Imaging [Ca2+]i with aequorin using a photon imaging detector. In Nuccitelli R. (ed). Methods in Cell Biology. Academic Press, Orlando, FL 1994; Vol. 40: pp 305-338. 1994.
47. Webb SE, Rogers KL, Karplus E, Miller AL. The use of aequorins to record and visualize Ca2+ dynamics: from subcellular microdomains to whole organisms. Meth. Cell Biol. 2010; 99: 263-300.
48. Klar TA, Jakobs S, Dyba M, Egner A, Hell SW. Fluorescence microscopy with diffraction resolution barrier broken by stimulated emission. Proc. Natl. Acad. Sci. USA 2000; 97: 8206-8210.
49. Créton R, Speksnijder JE, Jaffe LF. Patterns of free calcium in zebrafish embryos. J. Cell Sci. 1998; 111: 1613–1622.
50. Webb SE, Miller AL. Calcium signaling during zebrafish embryonic development. BioEssays 2000; 22: 113-123.
51. Ashworth R, Bolsover SR. Spontaneous activity-independent intracellular calcium signals in the developing spinal cord of the zebrafish embryo. Dev. Brain Res. 2002; 139: 131-137.
52. Jaimovich E, Reyes R, Liberona JL, Powell JA. IP3 receptors, IP3 transients, and nucleus-associated Ca2+ signals in cultured skeletal muscle. Am. J. Physiol. Cell Physiol. 2000; 278: C998-C1010.
53. Carrasco MA, Riveros N, Ríos J, Müller M, Torres F, Pineda J, Lantadilla S, Jaimovich E. Depolarization-induced slow calcium transients activate early genes in skeletal muscle cells. Am. J. Physiol. Cell Physiol. 2003; 284: C1438-C1447.
54. Cárdenas C, Liberona JL, Molgó J, Colasante C, Mignery GA, Jaimovich E. Nuclear inositol 1,4,5-trisphosphate receptors regulate local Ca2+ transients and modulate cAMP response element binding protein phosphorylation. J. Cell Sci. 2005; 118: 3131-3140.
55. Blake DJ, Weir A, Newey SE, Davis KE. Function and genetics of dystropin and dystrophin-related proteins in muscle. Physiol. Rev. 2002; 82: 291-329.
56. Leung CF, Miller AL, Korzh V, Chong SW, Sleptsova-Freidrich I, Webb SE. Visualization of stochastic Ca2+ signals in the formed somites during the early segmentation period in intact, normally developing zebrafish embryos. Develop. Growth Differ. 2009; 51: 617-637.
57. Guyon JR, Goswami J, Jun SJ, Thorne M, Howell M, Pusack T, Kawahara G, Steffen LS, Galdzicki M, Kunkel LM. Genetic isolation and characterization of a splicing mutant of zebrafish dystrophin. Human Mol. Genet. 2009; 18: 202-211.
58. Chambers SP, Dodd A, Overall R, Sirey T, Lam LT, Morris GE, Love DR. Dystrophin in adult zebrafish muscle. Biochem. Biophys. Res. Comm. 2001; 286: 478-483.
59. Berger J, Berker S, Hall TE, Lieschke GJ, Currie PD. Dystrophin-deficient zebrafish feature aspects of the duchenne muscular dystrophy pathology. Neuromuscular Disorders 2010; 20: 826-832.
60. Felsenfeld, AL, Curry M, Kimmel CB. The fub-1 mutation blocks initial myofibril formation in zebrafish muscle pioneer cells. Dev. Biol. 1991; 148: 23-30.
61. Eisen JS, Myers PZ, Westerfield M. Pathway selection by growth cones of identified motoneurones in live zebra fish embryos. Nature 1986; 320: 269-271.
62. Henry CA, Amacher SL. Zebrafish slow muscle cell migration induces a wave of fast muscle morphogenesis. Dev. Cell. 2004; 7: 917-923.